Choosing the Right Statistical Test: A Guide for Researchers
Selecting the right statistical test is crucial for meaningful quantitative data analysis. Numerical variables (interval and ratio) differ from categorical variables (nominal and ordinal), influencing test selection. Univariate tests compare a sample to a population (e.g., t-test, binomial test), bivariate tests examine relationships between two variables (e.g., t-test, ANOVA, chi-square, correlation), and multivariate tests analyze three or more variables (e.g., multiple regression, factor analysis). Key considerations include variable type, normality, independence, and statistical significance (p ≤ 0.05). Following these guidelines ensures valid and reliable statistical conclusions.
When analyzing quantitative data, selecting the correct statistical test is crucial for drawing meaningful conclusions. This blog-post acts as a guide for choosing the appropriate parametric statistical test based on your data and research goals.
Before selecting statistical tests, it is crucial to first understand the distinctions between different types of variables, as these determine the appropriate analytical approach and the validity of statistical inferences.
Differences between numerical and categorical variables:
Numerical Variables:
Definition:
Numerical variables represent data that can be measured quantitatively and have a numerical value. There are two types of Numerical variables: Interval and Ratio.
Interval variables: These variables have equal intervals between values, but no true zero point. Temperature in Celsius is an example. A difference of 10 degrees between 20°C and 30°C is the same as the difference between 30°C and 40°C. However, 0°C doesn't mean there is no temperature.
Ratio variables: These variables have equal intervals between values and a true zero point, indicating the absence of the quantity being measured. Examples include height in meters, income in EUR, or age in years. A height of 2 meters is twice as much as 1 meter. A income of 0 EUR means absence of income.
Examples of Numerical variables:
Physical height: Measured in centimeters or meters.
Satisfaction level: Measured on a scale from 1 to 5, where 1 = "not at all satisfied" and 5 = "completely satisfied".
Income: Expressed in EUR.
Loyalty: Measured on a scale, such as from 1=definitely never again, 5=I will be a regular customer in the future.
Quality of service: Measured on a scale, such as 1=very low quality, 5=quality at the highest level.
Distribution:
It's important to consider whether the data is normally distributed. If not, non-parametric tests may be more suitable.
Categorical Variables:
Definition:
Categorical variables represent data that can be divided into distinct categories or groups. These variables are not suitable for most mathematical operations. There are two types of Numerical variables: Nominal and Ordinal.
Nominal variables: These variables have categories with no inherent order or ranking. Examples include gender, marital status, or type of product.
Ordinal variables: These variables have categories with a meaningful order or ranking, but the intervals between categories are not necessarily equal. Examples include education level (e.g., high school, bachelor's degree, master's degree) or satisfaction level (e.g., very dissatisfied, dissatisfied, neutral, satisfied, very satisfied).
Examples of categorical variables:
Gender: Male, female, other.
Region: Province A, Province B, Province C.
Type of settlement: Village, City, Suburban.
Education level: Less than high school, high school, some college, college degree, post-graduate degree.
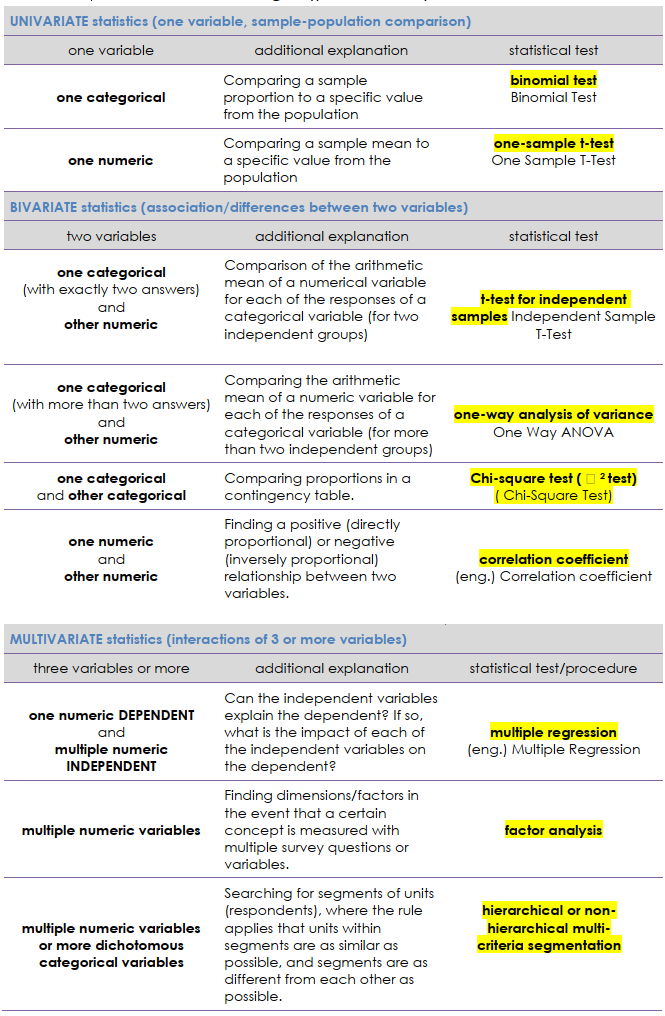
Univariate Statistics: Comparing a Sample to a Population
Univariate statistics involve analyzing a single variable. When comparing a sample to a population we suggests the following (for details see the table below):
One categorical variable: Use a binomial test to compare a sample proportion to a specific value from the population.
One numeric variable: Use a one-sample t-test to compare a sample mean to a specific value from the population.
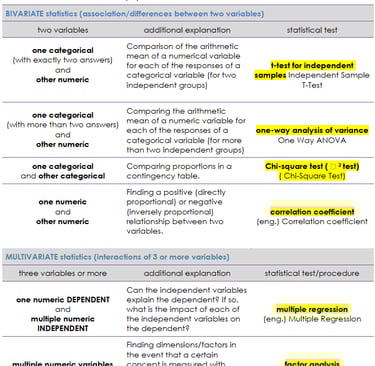
Bivariate Statistics: Associations/Differences Between Two Variables
Bivariate statistics explore the relationships or differences between two variables. Here's how to choose the right test (see the table below):
One categorical variable (with exactly two answers) and one numeric variable: Use a t-test for independent samples to compare the arithmetic mean of the numeric variable for each response of the categorical variable (for two independent groups).
One categorical variable (with more than two answers) and one numeric variable: Use a one-way analysis of variance (ANOVA) to compare the arithmetic mean of the numeric variable for each response of the categorical variable (for more than two independent groups).
One categorical variable and another categorical variable: Use a chi-square test to compare proportions in a contingency table.
One numeric variable and another numeric variable: Use a correlation coefficient to find a positive (directly proportional) or negative (inversely proportional) relationship between the two variables.
Multivariate Statistics: Interactions of Three or More Variables
Multivariate statistics examine the relationships among three or more variables. Some options include:
One numeric DEPENDENT variable and multiple numeric INDEPENDENT variables: Use multiple regression to determine if the independent variables can explain the dependent variable and the impact of each independent variable.
Multiple numeric variables: Use factor analysis to find dimensions/factors when a concept is measured with multiple survey questions or variables.
Multiple numeric variables or more dichotomous categorical variables: Use hierarchical or non-hierarchical multi-criteria segmentation to search for segments (groups) where units within segments are as similar as possible and segments are as different as possible.
Important Considerations
Level of Measurement: The type of variables (categorical or numerical) dictates the appropriate statistical test.
Normality: For numerical variables, consider whether the data is normally distributed. If not, non-parametric tests might be more suitable.
Independence: Determine whether the samples are dependent or independent. The below focuses on independent samples.
Statistical Significance: A statistical characteristic (sig.) helps determine if results from a sample can be generalized to the broader population. A risk level of at most 5% (sig. <= 0.05) is generally acceptable in the social sciences.

Statistics and methodology consulting
© 2025. All rights reserved.
Watch, like & subscribe on YouTube!
Please note: by contacting StatExpert.pro or using its resources, you agree to our policies: StatExpert.pro/policies.