Understanding the Correlation Coefficient
In the analysis of quantitative data, understanding the relationship between variables is crucial. The correlation coefficient is a statistical measure that quantifies the strength and direction of a linear relationship between two numerical variables.
What does the correlation coefficient measure?
The correlation coefficient measures how well two variables change together. The range of values is between -1 and +1:
+1: Perfect positive correlation. As one variable increases, so does the other in a consistent proportion.
0: No correlation. There is no linear relationship between the variables.
-1: Perfect negative correlation. As one variable increases, the other decreases in a consistent proportion.
It is important to emphasize that correlation does not necessarily mean causation. It may be that both variables are influenced by a third, unobserved variable.
Types of Correlation Coefficients
Pearson correlation coefficient: Measures the linear relationship between two numerical variables. It is used when the variables are normally distributed.
Spearman rank correlation coefficient: Measures the monotonic relationship between two variables. It is used when the variables are not normally distributed or are ordinal.
Suppose we want to check if there is a relationship between satisfaction (v2) and loyalty (v3). Both variables are numerical, with possible answers on a scale between 1 and 5, where a higher value on the scale means greater satisfaction or greater loyalty.
If the Pearson correlation coefficient between satisfaction and loyalty is 0.58, this means that there is a positive relationship between them. Higher satisfaction is associated with higher loyalty.
If the value is between +0.3 and +1, there is a (positive) directly proportional relationship between the two variables. If the value of the correlation coefficient is between -0.3 and -1, there is a (negative) directly proportional relationship between the two variables.
Choosing the Appropriate Statistical Test
The choice of statistical test depends on the type of variables (numerical/categorical). For numerical variables, it should be considered whether they have a normal distribution.
Important Reminder
When interpreting the correlation coefficient, the statistical significance (sig.) must be taken into account. If the sig. is less than or equal to 0.05, the results can be generalized from the sample to the entire population with great certainty.
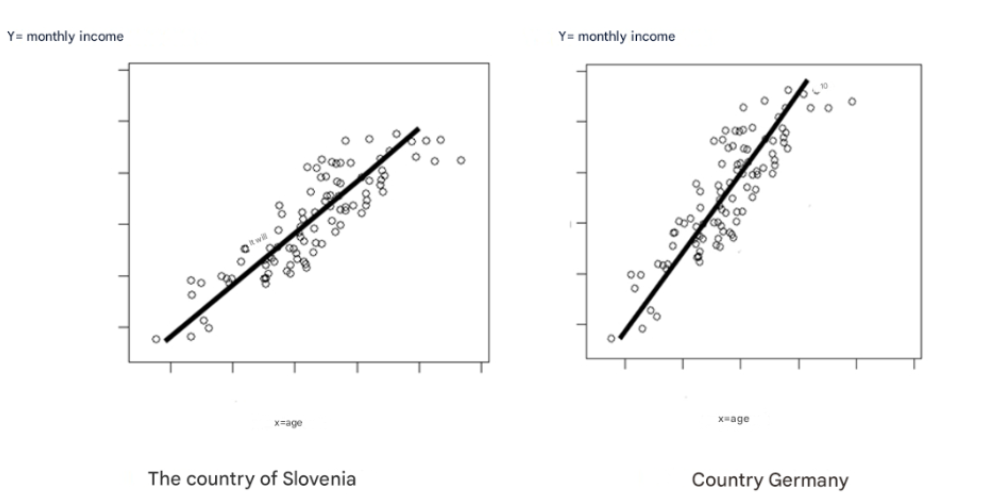
Correlation coefficient can be misleading
As shown in a below example, sometimes the correlation coefficient can be misleading. The correlation coefficient in both hypothetical cases is exactly +0.88, which indicates that the monthly income of the respondents
(marked by dots in the figure above) is proportional to age, i.e. younger people have a lower income, and older people have a higher one.
The correlation coefficient in the above example is the same for both countries, although the “slope” of the line is different. The correlation coefficient actually indicates the “deviation” of the points from the linear line, namely, the more the points “deviate” from the line, the closer the correlation is to the value 0 (zero), the more the
points are exactly on the line, the closer the correlation is to the value +1 (or -1, in the case of inversely proportional correlation).
In the mentioned hypothetical example, the correlation coefficient is misleading, since the linear relationship between age and income is present in both countries, but the “slope of the line” in Germany is significantly “steeper” than in Slovenia. This means, in other words, that respondents in Germany achieve relatively high incomes with fewer years or earlier. However, since the deviations from the straight line are exactly the same in both countries, despite the different "slope of the line", the correlation coefficient is the same in both countries, so in this
specific (imaginary) case it is misleading (it does not show that people in Germany achieve higher incomes earlier). In this case regression coefficient is more appropriate (for details see the blog about regression analysis).

Statistics and methodology consulting
© 2025. All rights reserved.
Watch, like & subscribe on YouTube!
Please note: by contacting StatExpert.pro or using its resources, you agree to our policies: StatExpert.pro/policies.